Breakthrough cases and the delta variant
I’ve had some discussions with people about the utility of vaccines against the variants of COVID-19. In general, my advice has been: mRNA vaccines will probably continue to provide the greatest protection, inactivated virus ones the least. I haven’t yet seen anything to alter that general advice.
There is a recent pre-print available on medRxiv, Comparison of two highly-effective mRNA vaccines for COVID-19, that is relevant here. Let’s take a look at this and see what we can learn.
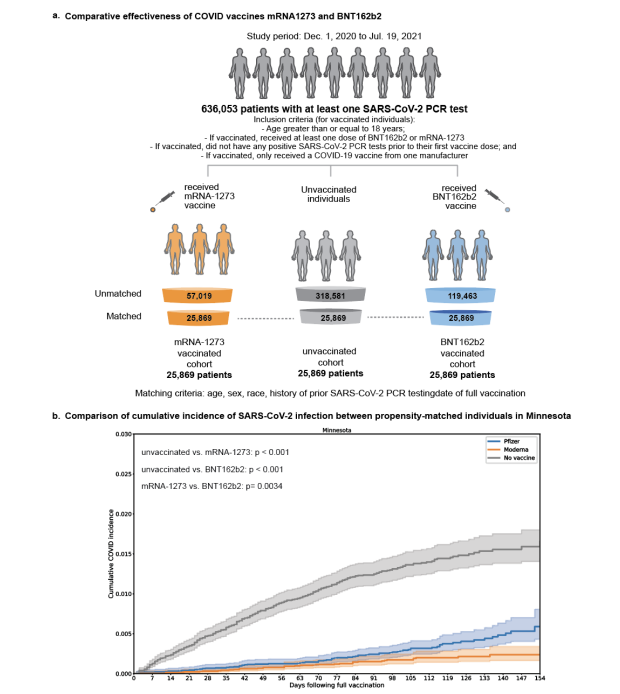
Fig 1 from Comparison of two highly-effective mRNA vaccines for COVID-19
As we get started, I should say that like some of the authors of this pre-print, I have an institutional affiliation with the Mayo Clinic. However, this constitutes my personal opinion, insofar as I am not representing any institution here, but it is also my professional opinion, as skilled engineer and statistician within this field. I am not qualified to diagnose disease. What I can do is tell you what patterns there are in this data.
The cumulative incidence curve is how the authors of the paper choose to start off, and I think you can see most of the big picture right here. There is a very large difference in getting COVID between vaccinated and unvaccinated populations, and a smaller, but still apparent one between the two mRNA vaccines from Pfizer (BNT162b2) and Moderna (mRNA-1273).
The next thing I would like to draw your attention to is that the shapes of the lines here are different. Not only different from each other, but from what I would expect, and I think this is important.
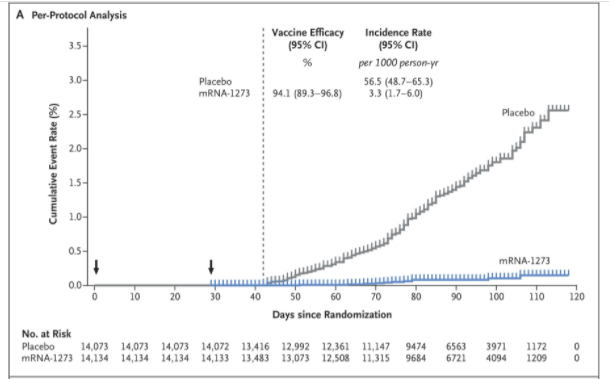
What I expect a vaccine efficacy curve to look like, from Efficacy and Safety of the mRNA-1273 SARS-CoV-2 Vaccine N Engl J Med 2021; 385:585-594
DOI: 10.1056/NEJMoa2108891
Let’s start with the unvaccinated population. That line in Figure 1 from the pre-print has a continuously decreasing slope. It actually looks like it is approaching an asymptote. I find that curious. The Pfizer vaccine line looks like it starts to curve up near the end. Not having access to the full data set, I can’t get too deep into it, but I will note here that the authors chose to subset their full data set by matching individuals on the basis of sex, age, and ancestry.
This isn’t a crazy idea, as the natural history of COVID-19 is hugely variable across those factors, as you can see in this CDC summary:

CDC cases by age group
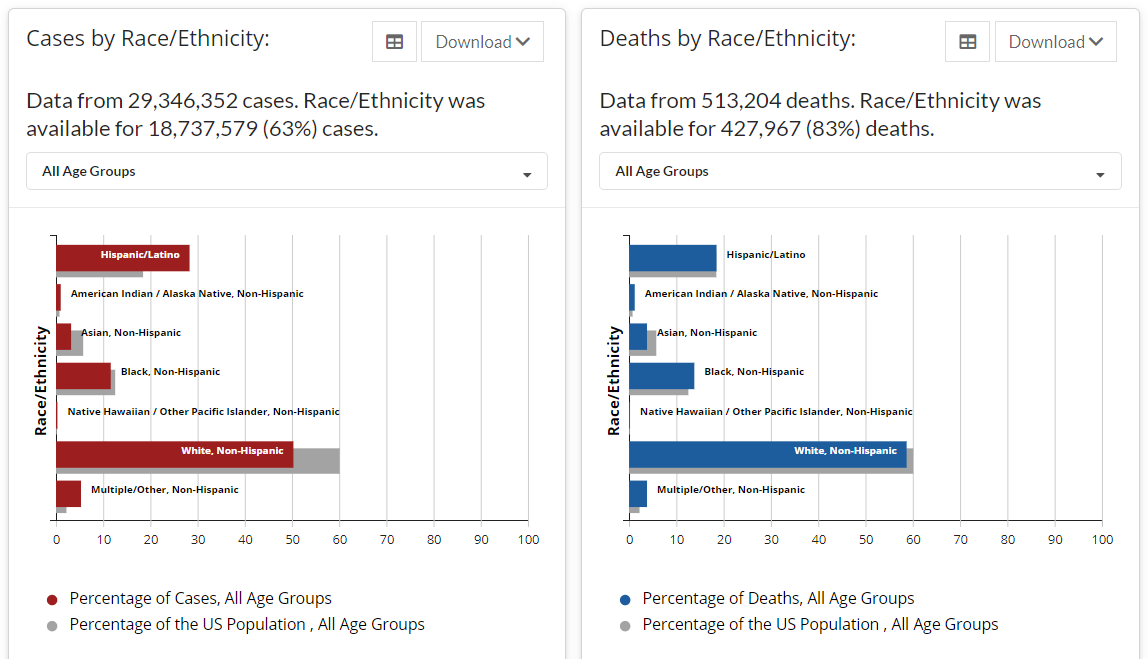
CDC cases by ethnicity
If you want to make a comparison between two groups, and those groups differ in age or ancestry or ethnicity, that comparison will be harder to do with effects like this. So, the authors created a subsample of their dataset by matching people up on those characteristics. There is an illustration of the process in Fig 1 above.
The advantage here is that you can directly compare rates across the groups. The disadvantages here, and there are at least two, are that we are leaving out most of the data, and running a serious risk of biasing our data by the selection procedure. If I had been asked, I would have advised that the authors not do this. It is really hard to do this kind of matching procedure ex post facto.
So, why do it? I am speculating here, but I think the reason is that the authors wanted to imitate the PhIII trial results. Specifically, that magic word effective, as in safe and effective, the standard by which the FDA judges vaccines and all other medical treatments. You can see that the way in which effectiveness was calculated is very similar to Moderna’s trial design:
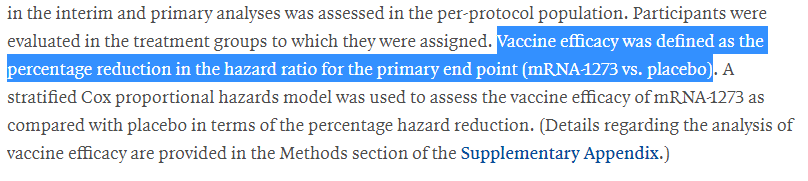
Moderna mRNA-1273 vaccine efficacy definition
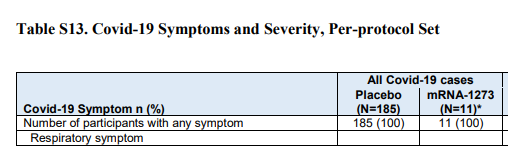
Moderna Phase III results
There is in fact a model lurking in the background, but the efficacy of mRNA-1273 is basically the number of cases in the treatment group divided by the number in the placebo group, that then subtracted from one: 1-(11/185)= 94.1%.
By subsetting the population in this way, the authors of this study wanted to imitate the structure of the clinical trial, which of course randomized individuals into the treatment or placebo groups, and had approximately equal population structures in the two groups.
Thus, we get to Figure 2, which is the whole reason I’m discussing this pre-print.

Fig 2 from the pre-print
In Figure 2, you see what looks like a slow decrease in effectiveness until the Delta variant comes on the scene in Minnesota, and then a bigger decrease. This is the big result, and why we are talking about this.

And I’m here to tell you that word doesn’t mean what you think it means, and we should be cautious about making claims of big effectiveness drops of the mRNA vaccines. Let’s look at why.
Table 2 from the paper has the numbers, and I’m going to take a picture and then copy the most relevant numbers into a table here in the blog post. The authors used the very technical unit of events/person-days, which makes sense in this context. However, when doing more general science communication, I think you can turn this into a much more intuitive measure without a large loss of accuracy: out of ten thousand people, how many will get sick in a month?
And you can get exactly that from Table 3.
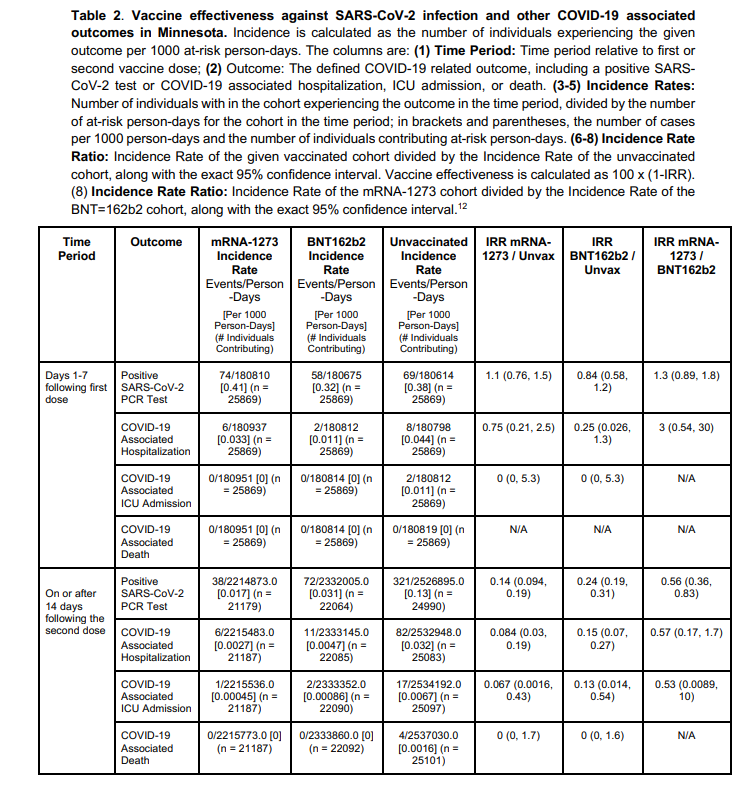
Table 2 from the pre-print

Table 3 from the pre-print
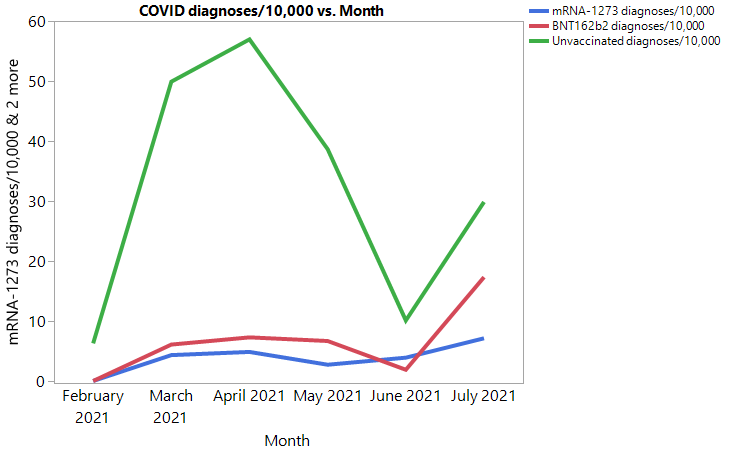
COVID diagnoses by vaccination status per 10,000 people from the pre-print
Here is a chart I made of the data in Table 3. You can see the basic structure of the three lines goes up and down at about the same time, but with some separation like we saw on the cumulative incidence chart the authors made.
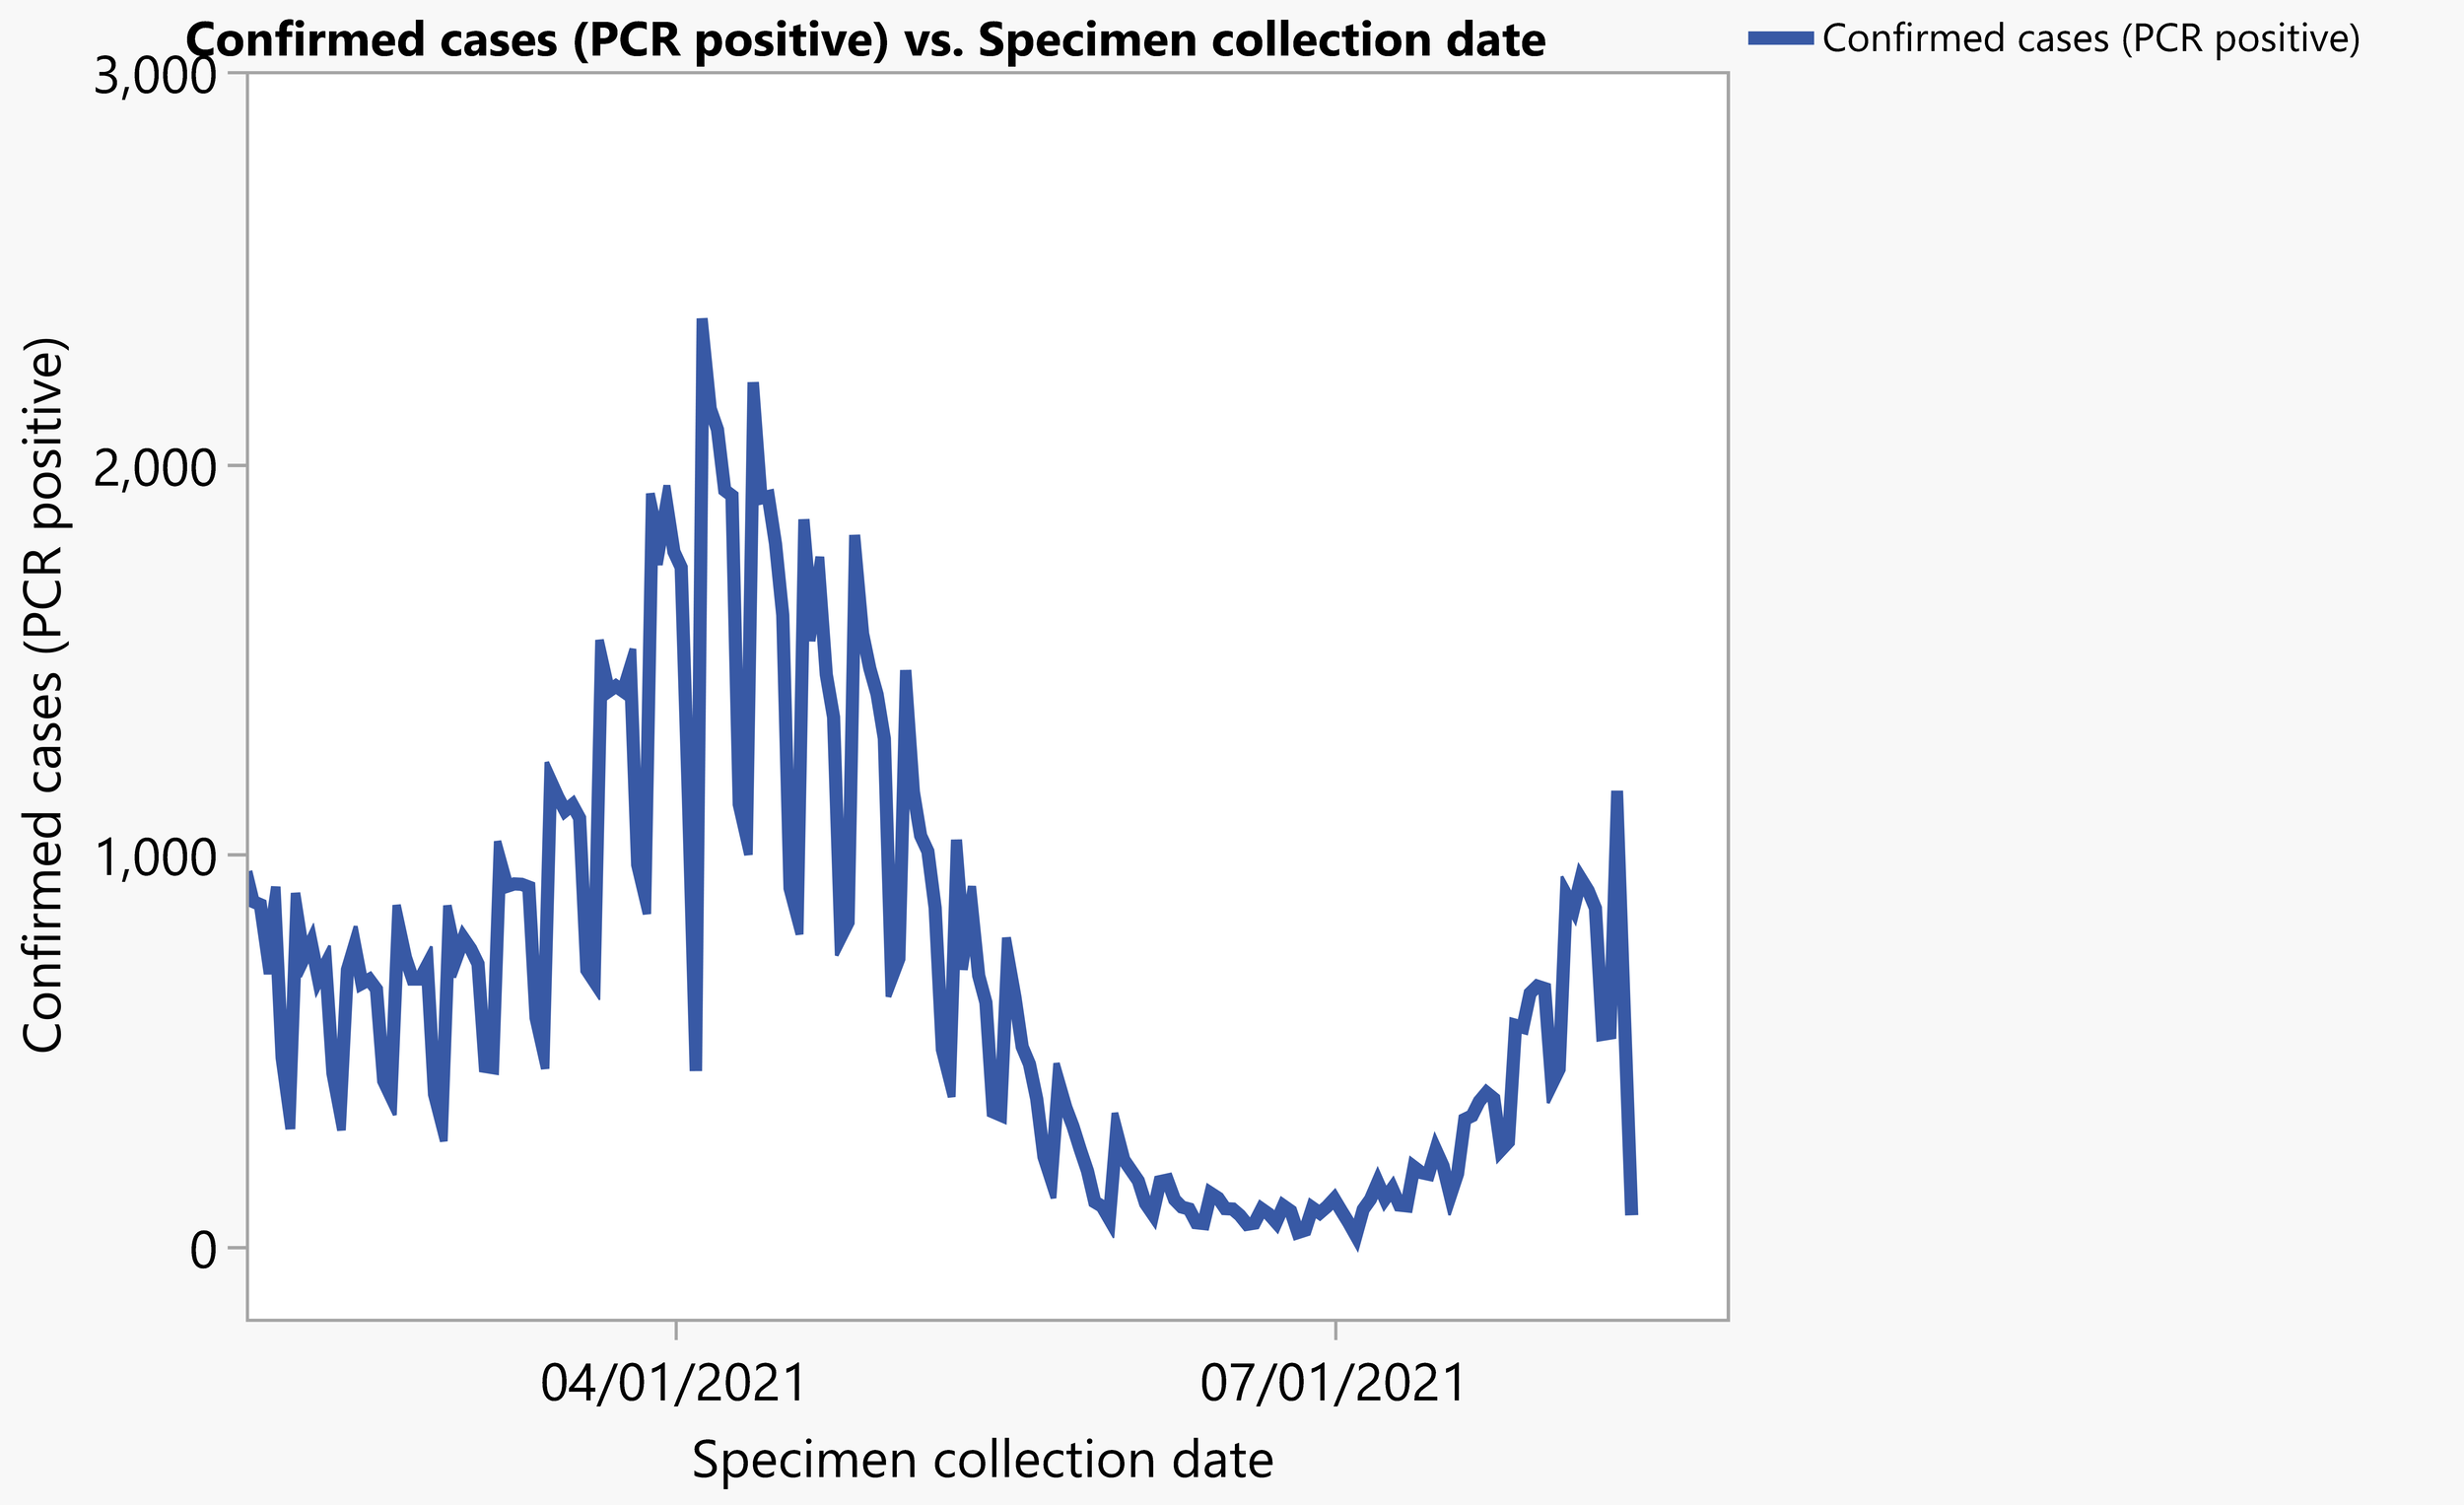
COVID diagnoses by PCR from Minnesota Department of Health
And here is a chart I made from data available on the Minnesota Department of Health website. You can see the same up and down shape in about the same proportions as the Table 3 data, which is a good thing. It increases confidence in the authors’ selection procedure.
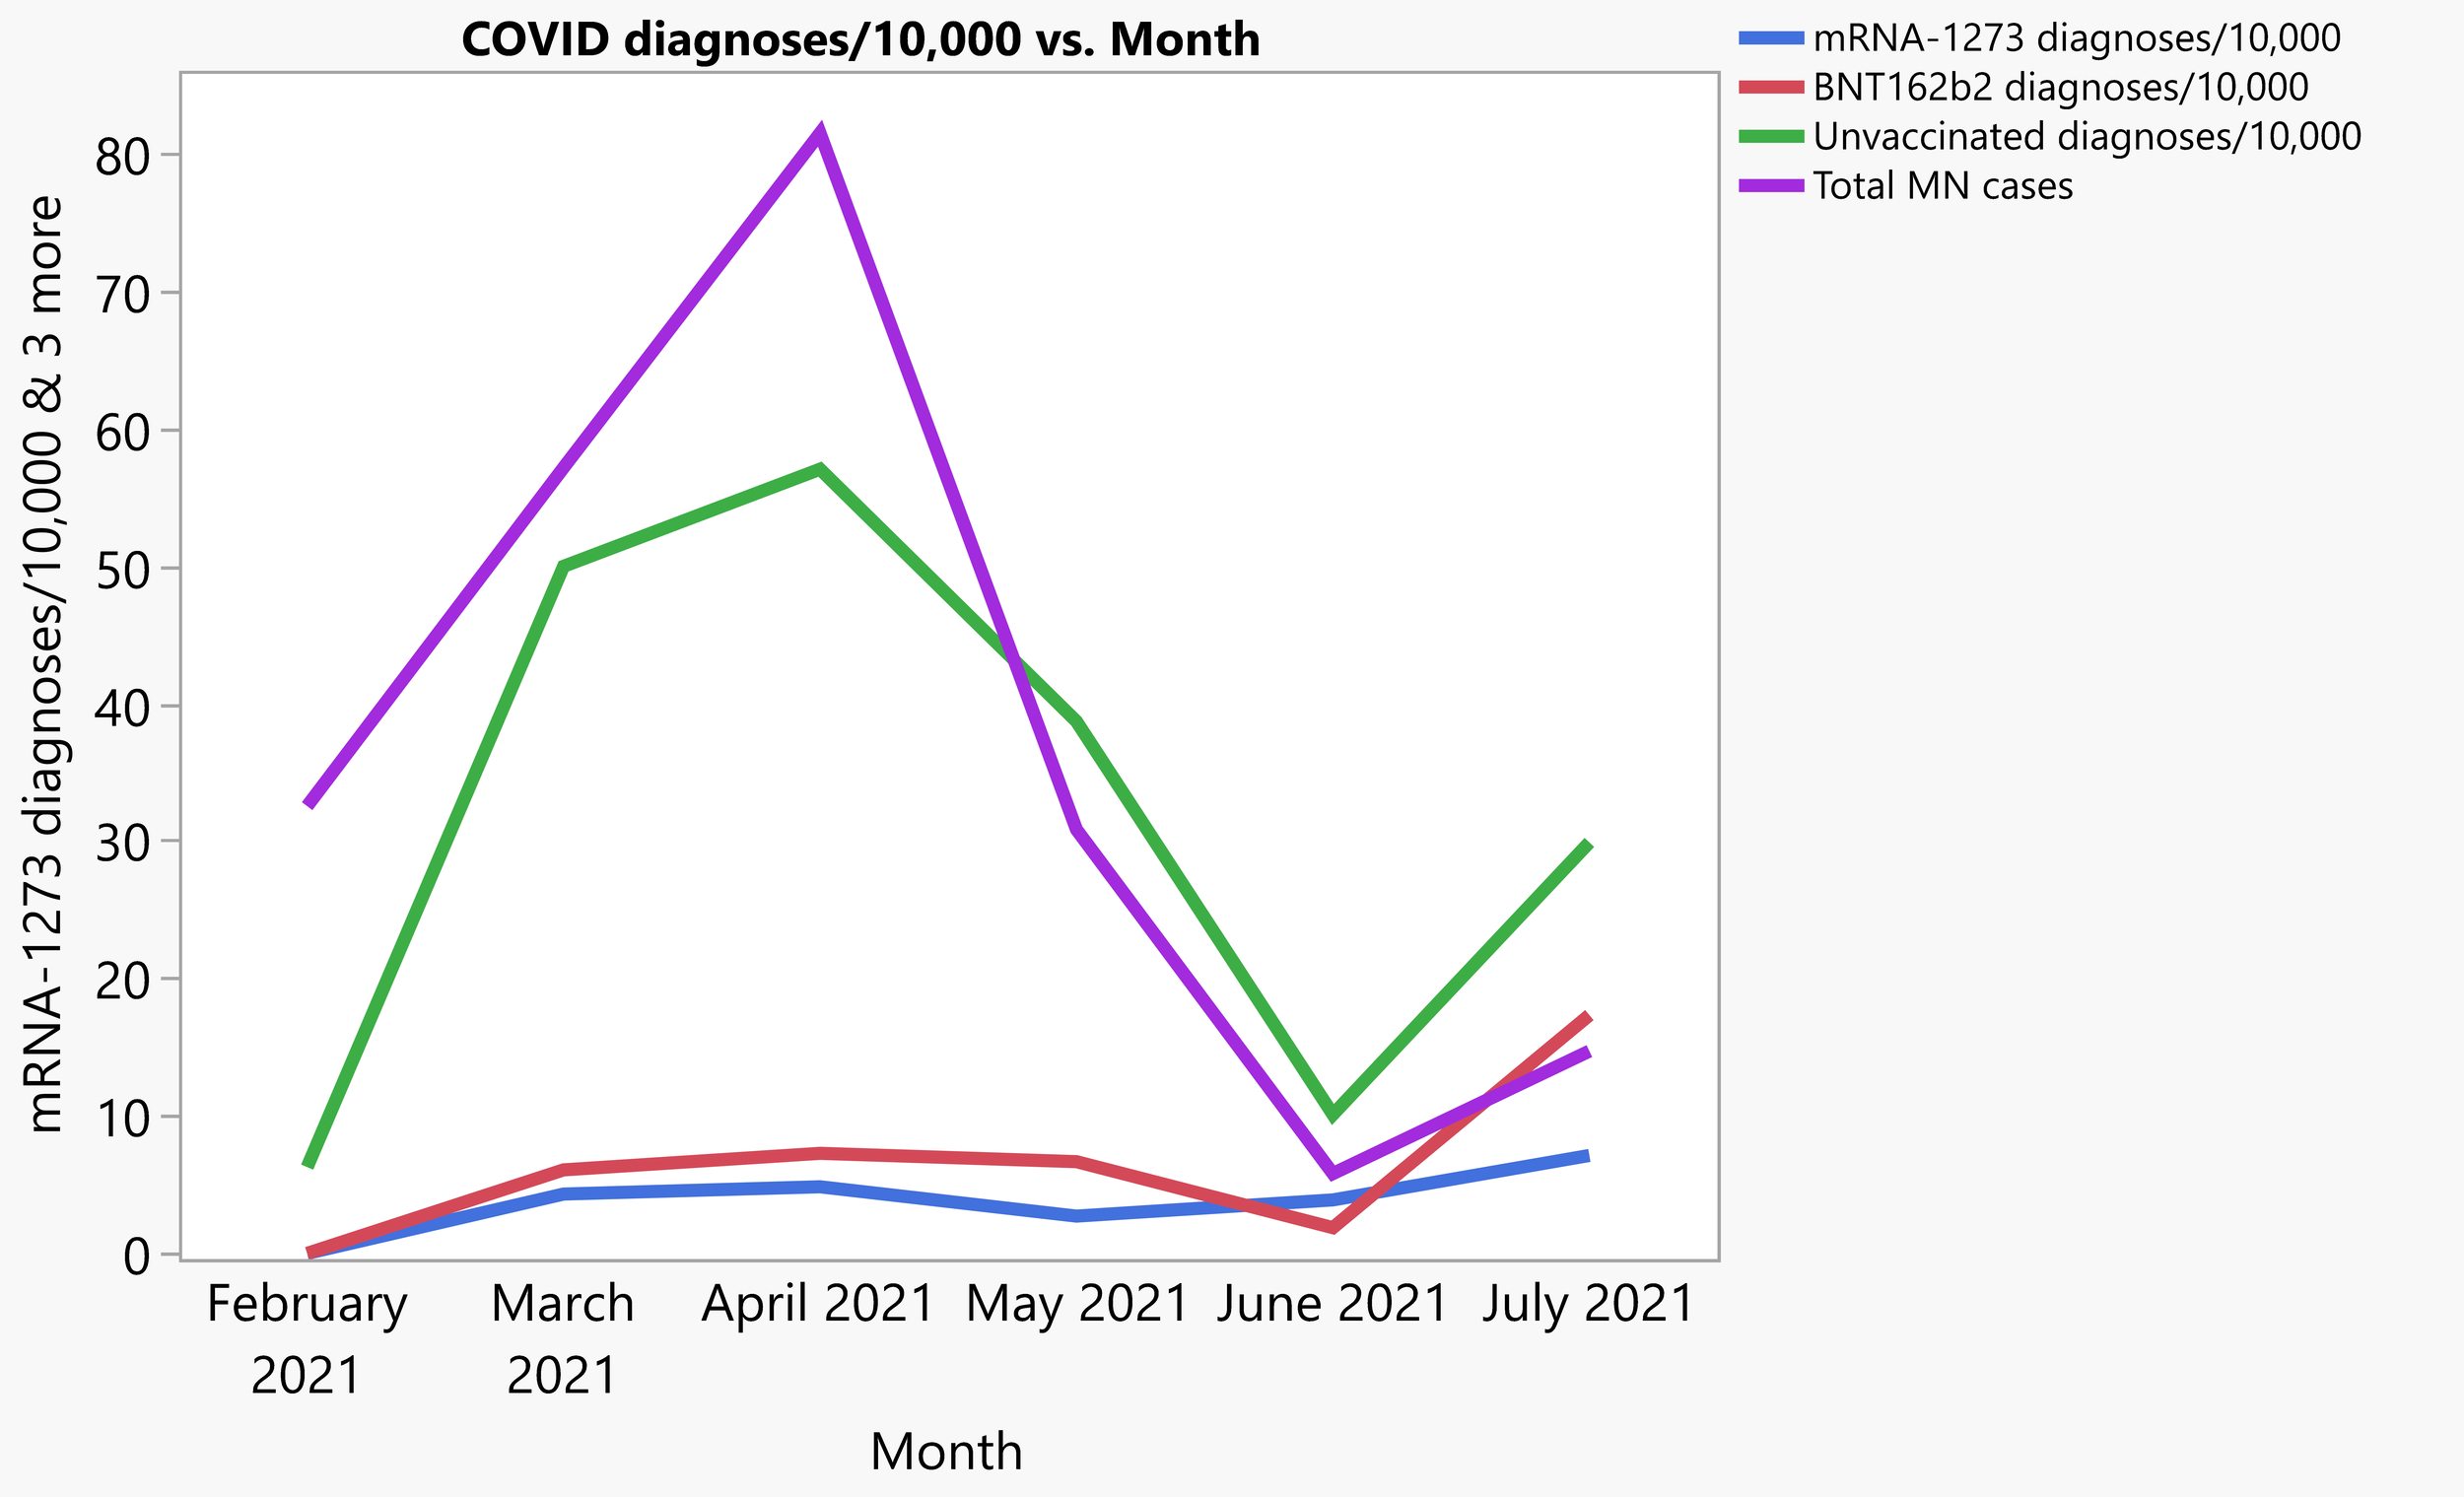
Pre-print and MN state numbers together
The next thing to look at is the Minnesota cumulative case rate from February 1st, 2021 to July 11th, which matches up this figure from the Minnesota Health Department on vaccine breakthrough cases:
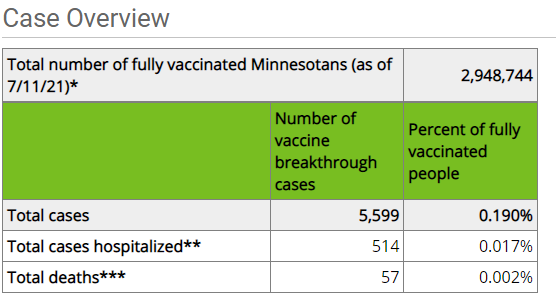
From the Minnesota cases file I linked above, we get 562,830 cumulative cases on 7/11/2021, and 445,535 cases on 2/1/2021, a net difference of 117,295 cases. Minnesota’s estimated population in 2019 according to the US Census Bureau was 5,639,632, giving us a case percentage of 2.08% during the same time period, roughly ten times more than the breakthrough infection rate of COVID-19, which is my rule of thumb for the mRNA vaccines in real world conditions, about 90% effective.
And you can see that for the months of February, March, April, and May, the difference in Table 3 between vaccinated and unvaccinated cases is about 1:10, right in line with what the other data shows. Now, the thing we really care about is did the delta variant change the situation? The figures certainly make it look so. But something bothers me.

This cumulative incidence curve shouldn’t curve down
The unvaccinated cumulative incidence curve from Figure 1 in the pre-print curves down, which if you take it seriously, would indicate that unvaccinated people have a continuously decreasing risk of getting a new case of COVID. I don’t think that’s quite right. It would be huge, if true. This was not seen in the Pfizer or Moderna Phase III trials.
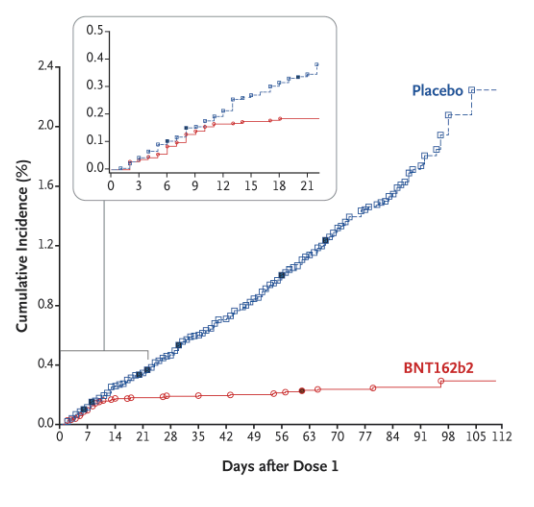
Pfizer vaccine cumulative incidence curve
It is possible that there is some kind of time series effect here. If I had access to the full data, I would want to see if the assigned “date of vaccination” for otherwise unvaccinated individuals was evenly distributed against things like date of PCR test. It is also possible that the pairing selection scheme has a bias, and we are just missing a ton of cases in the roughly 300,000 unused data points. A check of total occurrence rate of the 25,000 data points used against the 295,000 that weren’t might tell you if something big was different. I might check age and ethnicity distributions, in particular. Outside of clinical trials, the decision to get a COVID vaccine has been anything but random, with an intense effort to prioritize groups at higher risk. Such a thing would and did progressively depopulate the unvaccinated pool of higher risk individuals. If the denominator in the “effectiveness” calculation was too small, you would get a result like this one. In theory, the matching scheme was supposed to compensate for this, but such a thing is very very hard.
Of course, it is also possible that the data just is what it is. I would want to check these other things first, however. There is a reason that Phase III clinical trials are not run this way, with an after the fact pseudo-randomization. There really is a big chance of something odd happening, like predicting a rate of new COVID infections going to zero in five months. At the very least, I think the matching scheme needs another hard look. Especially since other studies with other structures have not found this result.


Comments ()