Animated Graphs using R and LaTeX
![Animated Graphs using R and LaTeX](/content/images/size/w1200/content/v1/51259dfce4b01b12552dad3e/1427671155684-KXLQOGY7XC2E8IX2VBV3/screen-shot-2010-10-26-at-7.42.49-am.png)
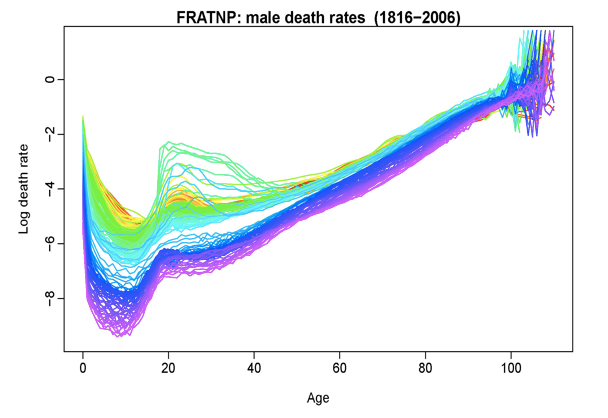
Here is a good example of how to create animated graphs using R and LaTeX. Even if you aren't interested in the details of how this is done, I am fascinated by the graph that is created, French male mortality by age by year.
![](https://www.benespen.com/content/images/content/v1/51259dfce4b01b12552dad3e/1427671155684-KXLQOGY7XC2E8IX2VBV3/screen-shot-2010-10-26-at-7.42.49-am.png.49+AM.png)
h/t TeXtip
Comments ()