Fst and Selection

Fst by number of migrants
Greg Cochran had an instructive Twitter exchange on Fst and adaption, which he expanded into a blog post at West Hunter.
Genetic similarity is usually described using the statistic Fst, fixation index. The fixation index is a useful number, but it doesn’t mean what a lot of people seem to think it means.
There are a variety of ways to calculate genetic similarity. Let’s look at the definition Greg gives:
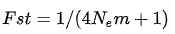
Fixation index, via Greg Cochran
N sub e m stands for number of migrants, with the sub e probably reminding you that it is a representation of people who not only moved into a new location, but successfully had kids, along with some simplifying assumptions. Since this is about gene flow, the mechanism is reproduction. If we take this formula, we can see what Fst looks like by number of migrants:
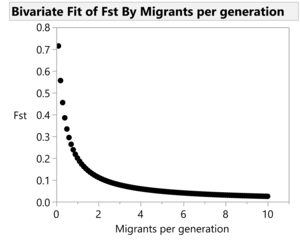
A plot of Fst values
So when Greg says that the number of migrants per generation needed to keep populations genetically similar is 1, he is describing where the knee of that plot is. You get real big changes in Fst to the left of that point, but the plot is basically flat as the numbers of migrants go up.
I think I can see why people get confused. One migrant per generation seems trivially small. And it is! But what does this degree of genetic similarity really mean? Wikipedia has a chart taken from the International HapMap project:
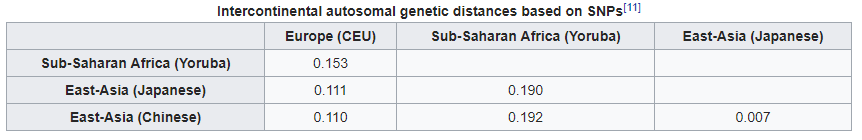
Fst across the world
An average number of migrants per generations equal to one gets you approximately the genetic distance between white Mormons in Utah plus some Italians (CEU) and the Yoruba people (YRI).
![Yoruba dancersAyo Adewunmi [CC BY-SA 4.0 (https://creativecommons.org/licenses/by-sa/4.0)], from Wikimedia Commons](https://storage.ghost.io/c/dc/b8/dcb86e6c-6ae6-4f37-a297-4e1c7a956a0f/content/images/content/v1/51259dfce4b01b12552dad3e/1546969522326-HZ6DH2RXABS4LP58EQMU/ayo_adewunmi_-_yoruba_dancers.jpg)
Yoruba dancers
Ayo Adewunmi [CC BY-SA 4.0 (https://creativecommons.org/licenses/by-sa/4.0)], from Wikimedia Commons
In this context, we can see that similar is far from identical. Other than obvious differences in appearance, sub-Saharan Africans like the Yoruba often differ from Europeans in things like malaria resistance or salt retention, so there are real differences in addition to real similarities. In theory, Fst goes from zero to one, but in practice we see numbers of 0.16 or less.
Much of the argument on Twitter was whether you could get any real genetic differences by selection with an average number of migrants per generation around 1. It certainly seems possible to me! Fst is a pretty high level model, and in general is calculated looking at lots of different loci. For selection to occur, you only need the frequency of one gene to change [for simple adaptions], which could readily happen without affecting Fst estimates at all. Based on this, Fst isn’t real useful in determining whether selection occurred. You would be better off looking for selection directly.

Comments ()