Is the rate of intellectual discovery slowing?

Earlier this month on Jerry Pournelle's website, I saw some discussion about whether the rate of technological progress is slowing. This is something that I had heard before, so I thought it might be interesting to look into the subject a little further.
The discussion on Chaos Manor cited an article on Taki's Mag, and another from IEEE Spectrum. The article on Taki's further cites Charles Murray's Human Accomplishment. Murray did make a similar claim in Human Accomplishment, but I think it might be interesting to revisit some data from Cycles: The Science of Prediction. If you have ever heard the urban legend that a Patent Commissioner once wanted to close the US Patent Office because there was nothing left to invent, this is the data the mythical commissioner was probably looking at. The data in the image below comes from the work of Pitrim Sorokin, in his book The Crisis of our Age. The data on inventions and discoveries is not graphed, so I did that below, both on linear and semilog scales.

Pp. 218-9 of Cycles: The Science of Prediction
There is a very clear flattening of the curve when plotted this way. It looks pretty similar no matter which way you plot it. It is somewhat unclear from Sorokin's book what counts as a scientific discovery or invention, so I'll look at US Patent rates instead.

Sorokin Data on Linear and Semilog Axes
The graph on page 219 of Cycles ought to be pretty easy to reproduce. The US Patent and Trademark Office has the total number of patents issued up to the present:
http://www.uspto.gov/web/offices/ac/ido/oeip/taf/h_counts.htm
http://www.uspto.gov/web/offices/ac/ido/oeip/taf/h_counts.pdf
And the US Census has population estimates for each year:
http://www.census.gov/popest/national/national.html
But only back to 1900, so I'll truncate the patent data there. This is what we get.
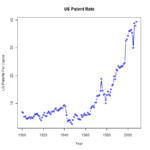
US Patents Per Capita
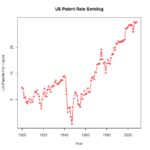
US Patents Per Capita Semilog
The answer is no, the rate of US Patents at least is not slowing per capita. There is a big dip in WWII, and a big spike in 1976, but otherwise looking at the log plot we see a very steady slope from WWII to the present. That big spike in 1976 is strange. Looking at the patent applications on the same graph, there was an upsurge in applications before 1976, but the rate of applications was flat until 1984, when it took off. Apparently, more and more of the applications were resulting in patents until that point.

US Patent Applications and Issued Patents Semilog
The graph does basically reproduce the features on Dewey and Dakin's graph in the period 1900-1944, but it seems smoother, which is probably because they smoothed all their data, since it was part of their theory of cycles that you applied Fourier analysis to time series data to find persistent cycles. They smoothed their data to make this easier.


Comments ()