Cycles: The Science of Prediction
Cycles: The Science of Prediction by Edward R. Dewey and Edwin F. Dakin
[I discovered I accidentally deleted this book review during site maintenance. I reposted it and redirected the old URL to this page.]
By Edward R. Dewey and Edwin F. Dakin
Henry Holt and Company 1949
307 Pages; US$42.95
Cycles is a book from the youth of modern statistics. The field was young, and progress was rapid. You can taste the optimism. The regular abuse of statistics was still in the future, and calculations were simple because you had to do them by hand. Wonderful new applications were just lying about, awaiting an intrepid analyst to make use of them. So, someone applied statistics in a new way to the world of economics. Dewey and Dakin wished to be able to more accurately predict the growth of whole nations, and the businesses within them. The authors were attempting to add rigor to the field of political economics, regarding it as hitherto little better than a voodoo science.
The debt of the authors to those whose names, equations, and graphs line the pages of this book -- and to many others unnamed -- is without end. Theirs is the pioneering work that is moving economics out of the blind alley where it stood for many years, so that it can take its rank as a true science. Cycles p. xii
Cycles is primarily about sigmoidal growth curves and the application of Fourier analysis to time-series data, with examples chosen primarily from economics. That is a pretty terse characterization, so let me unpack it.
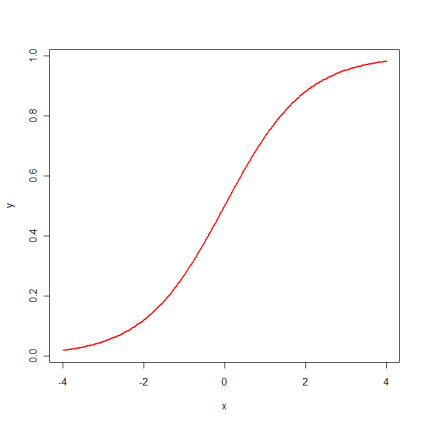
Sigmodal or Logistic Curve
Sigmoidal or logistic growth curves were first suggested by Pierre Verhulst in 1838 to describe the growth of any population of living organisms. The sigmoidal function has a characteristic 's' shape that describes how a population starts off slowly, then grows quickly, then slows its rate of growth until it reaches the maximum carrying capacity of its environment.
From animal populations, it was a short leap to applying the logistic curve to human populations. There are some very interesting graphs in the book. One I especially liked was the sigmoidal fit to the population of the United States, with a predicted equilibrium population of 200 million or so. [p. 15] Dewey and Dakin wanted to extend the ecological discovery of the logistic curve into the world of business. Using sales or production data, Dewey and Dakin tried to systematize the business cycle by analogizing a business to an organism. The sales or production data were plotted as time-series, and then a logistic curve was fit to the data. This works extremely well, and a plethora of examples are given in the book. One of the more interesting graphs is created by plotting a generic logistic curve, and then placing an industry on the curve in the place where the slopes [rate of growth] match, thus creating a simple visual representation of the 'age' of an industry. This actually works pretty well, with television far down at the 'young' end of the spectrum, oil in the middle, and horse buggies at the 'old' end. [p. 49]
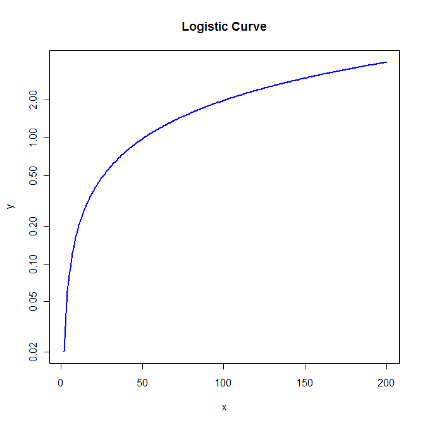
Logistic Curve on Log or Ratio Scale
Looking at the rate of growth, rather than absolute growth, is key to Dewey and Dakin's method. By doing so, one can more clearly see changes in the curve than with absolute numbers, especially if the scale gets very large. This is easily done by means of a semi-log or ratio plot. When one does so, it becomes clear that the rate of growth is continually decreasing until it approaches zero.
Time-series data are any kind of data plotted against time. This could be the aforementioned population growth curve, or stock prices, or even the tides. Most anything can be turned into a time-series simply by graphing the data in the order they were collected.
Fourier analysis is the the really fun one of the lot. Joseph Fourier discovered that most any repeating pattern could be created by the addition of a number of sine and cosine functions using the superposition principle.
Fourier Expansion
This can be used on phenomena like sound waves to break them down into a collection of pure tones. One can then recreate the original sound by combining the pure tones. This technique is very useful for waves of all types, but it turns out to have more general applications.
Next come the eponymous cycles. A great deal of the book is devoted to analyzing cycles that can be observed in nature and business, with periods of 54, 18, 9, and 3.5 years. Various phenomena are related to these cycles. For example, the 18 year cycle is identified as the real estate cycle in the United States. Common stocks are said to rise and fall with a rhythm of 9 years, while industrial production moves in 3.5 year waves. The data presented here is certainly intriguing, but I remain skeptical. It would be an interesting exercise to see whether the cycles have continued for the last 60 years since the book was updated.
At least part of the reason I am skeptical about the cycles is the use of moving averages, which are one of a class of statistical tools known as 'smoothers'. Smoothers are very dangerous statistically, because their use before analysis can result in inflated R2 and p-values. Smoothers work well for visualization however, and that is their primary use in Cycles. Dewey and Dakin did not compute any statistics for their cycles, probably because the mathematics was too tedious at the time. This is now more readily possible, but the same computer power makes it possible to diagnose the failures of smoothers by means of Monte Carlo analysis.
With the general growth curve and the cycles covered individually, Dewey and Dakin then show how to combine them, cycles riding on trends. This is probably the most interesting part of the book. It is analogous to learning to think in three dimensions instead of two. It is relatively easy to imagine a trend or a cycle continuing as they have before, but to put them together is really interesting. Even more so when you have several different cycles all together. This is where Fourier analysis can be really helpful, but allowing you to isolate different cycles from a mass of data.
Once this is done, we can attempt to apply all this knowledge. The ultimate goal is to discern whether an up or downtick in business is temporary or permanent. Business strategy is very different between weathering a dry spell and preparing for a long downward slide. Dewey and Dakin went so far as to predict in the first edition of their work that American business would experience a temporary downturn immediately after the Second World War, but that business would pick up afterward and a new era of prosperity would follow. In this, they disagreed with the majority of economists at the time, who reasoned that the war had cured the Depression, but that with the war over the Depression would return, and millions of returning GIs would find as little work as they had when the war started.
Dewey and Dakin turned out to be right, which is why this book is interesting. It was reissued in 1950 with a postscript containing additional data to bolster the claims of the original volume. I surmise that the book has had some influence, because rate of growth has since become a key business indicator, so much so that businesses dread a decrease in the growth rate, even if profits are healthy. Growth just has to slow down, not even stop, for a company's stock to plunge in value. This leads to the pursuit of growth at any cost, the attempt to start a new logistic curve instead of simply riding out the current one.
An interesting case study of this is the Wilkinson Sword Company. You may never have heard of them, because they stopped making swords in large quantities long ago, and stopped making swords entirely by 2005. What they have made since are things like beach furniture and lawn mowers, been bought and sold multiple times, and today they make the Schick Quattro. A fine consumer product, to be sure, but you cannot buy their excellent swords any longer. This is a lot to lay on Dewey and Dakin, but this is what immediately came to mind.
This book also occasioned a burst of massive skepticism on my part. Chapter II presents a series of logistic curves fit to the populations of various nations. The curve fits reasonably well in all cases, which means that birth rates tend towards equilibrium all on their own. A modern truism is that increasing education and standards of living lead to a decrease in the birthrate. However, it rather seems that birthrates would be trending down regardless, because that is just what they do after an initial burst of procreation. All the curves in this book predate any kind of emancipation of women or effective birth control, so clearly something else was at play. I do not know that increasing education and decreasing birthrate are unrelated, but on reflection I do not know that anyone has ever shown them to be related either. It simply fits the grand metanarrative of Western modernity, and so correlation is more than sufficient in most eyes.
This was a very interesting book, well worth a quick read, for it is blessedly short. The graphs in particular are beautifully done, well scaled, not too busy. Dewey and Dakin also take up some interesting asides, including the question of whether scientific innovation is slowing down [p. 218], and the metahistory of Spengler as applied to Chinese dynastic cycles [p. 201]. However, this book is much less dense, and more readable than most of the more advanced tomes that have addressed the same subjects, and that is a worthy accomplishment.

Comments ()