Income distributions by undergraduate major
Something I hear pretty frequently when I bring up one of these Payscale reports is that I should include an estimate of the spread in the data. This is an excellent point, so I turned again to the National Center for Education Statistics. They have a PowerStats tool that lets you make custom reports very easily.
I looked up a dataset that followed 9,000 students for 10 years after they earned their baccalaureate degrees, and asked for the average income by major, and a 95% confidence interval on that average.
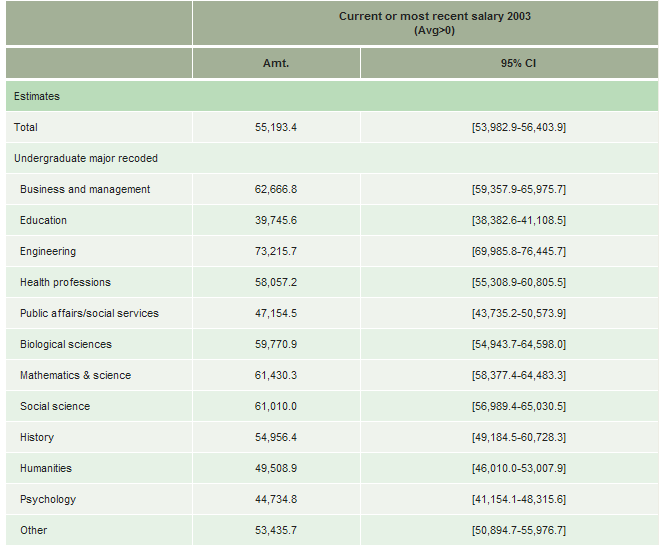
Income by undergraduate major
I was a little surprised at some of the results. An average income of $61,000 for social science majors? I decided that I should drill down, so I limited the results to those respondents who had not subsequently earned a graduate or professional degree.
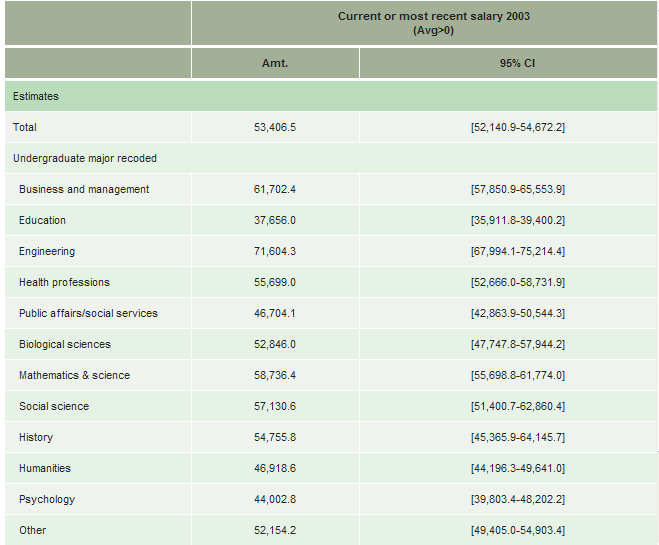
Income by undergraduate major, bachelors onlyNot all that different, although the decrease is slightly different in each group. So, I decided to subtable each occupational category, and then look at the distribution of people in each occupational category by undergraduate major.
I turned these tables into PDFs because they are so large, but it turns out that almost half of those who major in the social sciences go into either business or law-related professions, and they do quite well there.
Income by undergraduate major and occupation category
Percentage distribution of occupational category by undergraduate major.
Files in comma-delimited format:
Average income and 95% CI by undergraduate major
Income by undergraduate major limited to those who did not earn a graduate or professional degree

Comments ()